


การกระจุกและกระจายตัวของประชากรและครัวเรือนเป็นข้อมูลพื้นฐานที่ช่วยนำไปใช้วางแผนและจัดการระบบสาธารณูปโภค สาธารณูปการ ตลอดจนบริหารจัดการสินค้าและบริการ
จากข้อมูลจำนวนประชากรและจำนวนครัวเรือนรายจังหวัดของประเทศไทยที่เผยแพร่ผ่าน web site : stat.bora.dopa.go.th ของกรมการปกครอง โดยเบื้องต้นจำนวนประชากร คือ การนับจำนวนประชากรที่มีชื่ออยู่ในทะเบียนบ้านและทะเบียนบ้านกลาง จำนวนประชากรที่มิใช่สัญชาติไทย และจำนวนประชากรที่อยู่ระหว่างการย้าย ส่วนจำนวนครัวเรือนนับจากจำนวนทะเบียนบ้านที่มีเลขที่บ้านแตกต่างกัน โดยทะเบียนบ้านเลขที่หนึ่งอาจจะมีผู้อยู่อาศัยหรือไม่มีผู้อยู่อาศัยจริง (ถ้าทะเบียนบ้านเลขที่หนึ่งมีสมาชิกอยู่ในทะเบียนบ้าน สมาชิกอาจจะเป็น สมาชิกครอบครัว ญาติ ผู้พักอาศัย บุคคลที่ไม่ได้อาศัยอยู่จริงแต่ยังมีชื่ออยู่ในทะเบียนบ้าน และหรือบุคคลอื่นที่มีชื่ออยู่ในทะเบียนบ้านเดียวกันก็ได้) ทั้งนี้เมื่อมาสรุปและแสดงผลให้เห็นในรูปตารางข้อมูล แผนภูมิและแผนที่จะพบลักณะการกระจายตัวของประชากรและครัวเรือนดังนี้
Based on provincial population and household data published on the Department of Provincial Administration (DOPA) website at stat.bora.dopa.go.th, the population count generally includes persons registered in household registration records and central household registration records, non-Thai nationals, and persons in the process of changing their registered address.
The number of households, meanwhile, is based on the number of household registration records with distinct house numbers. A single house registration may have residents or may have no actual residents. If a household registration has members listed in it, those members may include family members, relatives, residents, persons who do not actually reside there but whose names remain registered at the address, and/or other persons registered in the same household.
When these data are compiled and presented in the form of tables, charts, and maps, patterns in the spatial distribution of population and households can be observed as follows:
มองการกระจายตัวของประชากรจากจำนวนประชากรแต่ละจังหวัด
Population Distribution Based on Provincial Population
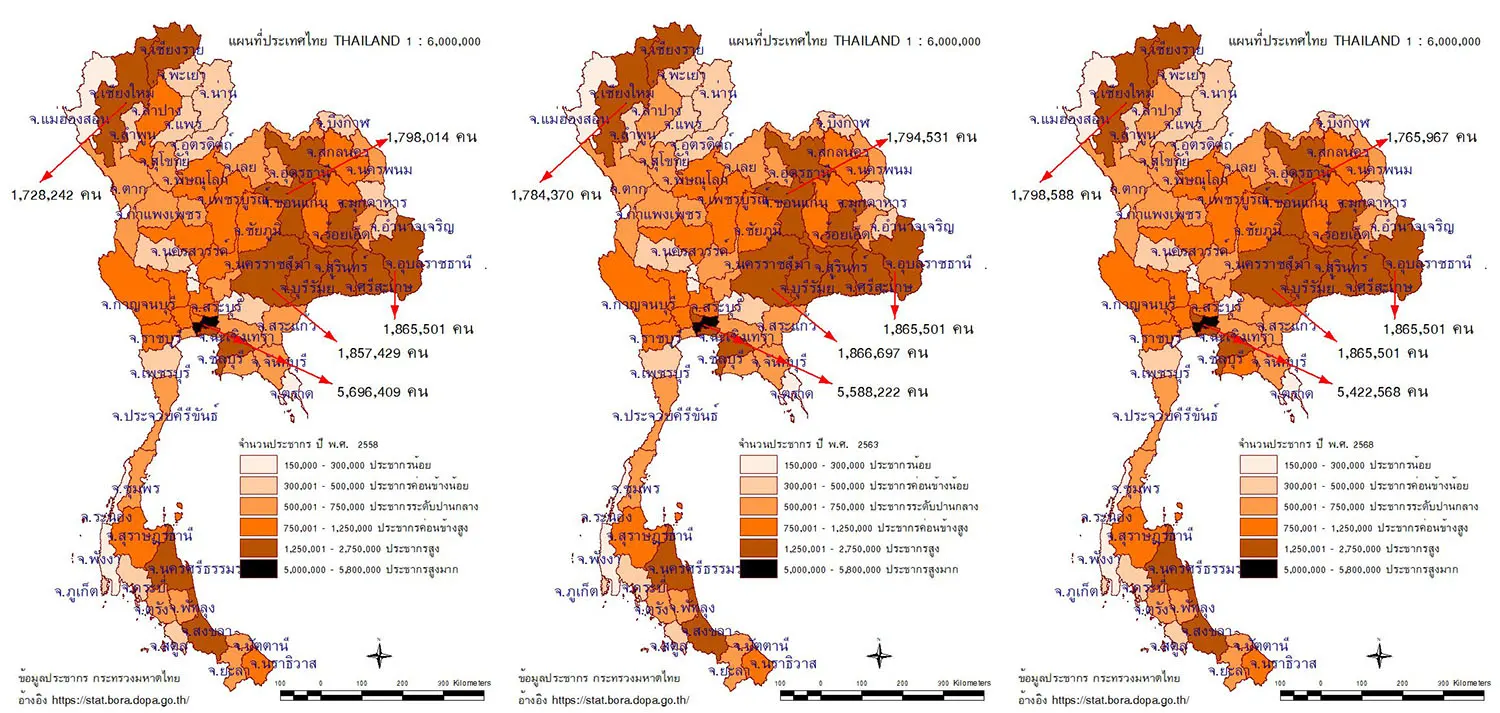
รูปที่ 1 กระจายตัวของประชากรในปี พ.ศ. 2558 2563 2568
Figure 1. Population Distribution in 2015, 2020, and 2025
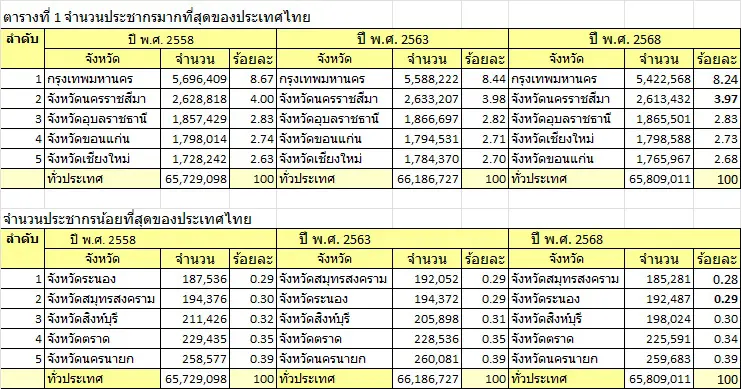
จากข้อมูลจำนวนประชากรสิ้นปี 2568 พบว่าจังหวัดที่มีประชากรจำนวนมากที่สุด 5 อันดับ (ตารางที่ 1) คือ กรุงเทพมหานคร นครราชสีมา อุบลราชานี เชียงใหม่ ขอนแก่น ตามลำดับ จังหวัดที่มีประชากรจำนวนน้อยที่สุด 5 อันดับ คือ สมุทรสาคร ระนอง สิงห์บุรี ตราด และนครนายก ตามลำดับ และเมื่อพิจารณาย้อนหลังไป 5 ปี (ปี พ.ศ. 2563) และ 10 ปี (พ.ศ. 2558) จังหวัดที่มีประชากรจำนวนมากที่สุด และจังหวัดที่มีประชากรจำนวนน้อยที่สุด 5 อันดับก็ยังเป็นกลุ่มจังหวัดเดิม
Based on the population data at the end of 2025 (B.E. 2568), the five provinces with the largest populations (Table 1) were Bangkok, Nakhon Ratchasima, Ubon Ratchathani, Chiang Mai, and Khon Kaen, respectively. The five provinces with the smallest populations were Samut Sakhon, Ranong, Sing Buri, Trat, and Nakhon Nayok, respectively. When looking back five years (2020; B.E. 2563) and ten years (2015; B.E. 2558), the five provinces with the largest and smallest populations remained largely the same group of provinces.
เมื่อพิจารณานำข้อมูลจำนวนประชากรแต่ละจังหวัดมาแสดงเป็นแผนที่ (รูปที่ 1) พบว่า ในปี พ.ศ. 2568 กลุ่มจังหวัดที่มีประชากรจำนวนมากจะปรากฏเด่นชัดบริเวณภาคตะวันออกเฉียงเหนือ เมื่อพิจารณาย้อนหลังไป 5 ปี (ปี พ.ศ. 2563) และ 10 ปี (พ.ศ. 2558) กลุ่มจังหวัดที่มีประชากรจำนวนมากก็ยังปรากฏเด่นชัดบริเวณตอนใต้ของภาคตะวันออกเฉียงเหนือตอนเช่นกัน
When the population data for each province are represented on maps (Figure 1), it can be observed that in 2025 (B.E. 2568), provinces with large populations are particularly prominent in the northeastern region of Thailand. Looking back five years (2020; B.E. 2563) and ten years (2015; B.E. 2558), provinces with large populations continued to be particularly prominent in the southern part of the northeastern region.
อย่างไรก็ตาม สังเกตได้ว่าจังหวัดที่มีประชากรจำนวนมากคือจังหวัดที่มีพื้นที่มาก จังหวัดที่มีประชากรจำนวนน้อยคือจังหวัดที่มีพื้นที่น้อย หากมีการพิจารณาอย่างเหมาะสม โดยดูจากสัดส่วนของจำนวนประชากรกับขนาดพื้นที่แต่ละจังหวัด (ความหนาแน่นของประชากร) จะพบลักษณะการกระจายตัวของข้อมูล ดังนี้
However, it should be noted that provinces with large populations are generally provinces with large land areas, while provinces with small populations tend to have smaller land areas. A more appropriate assessment can be made by examining the proportion between population size and the area of each province (population density). This reveals the following spatial distribution patterns:
รูปที่ 2 ความหนาแน่นประชากรใน ปี พ.ศ. 2558 2563 2568
Figure 2. Population Density in 2015, 2020, and 2025
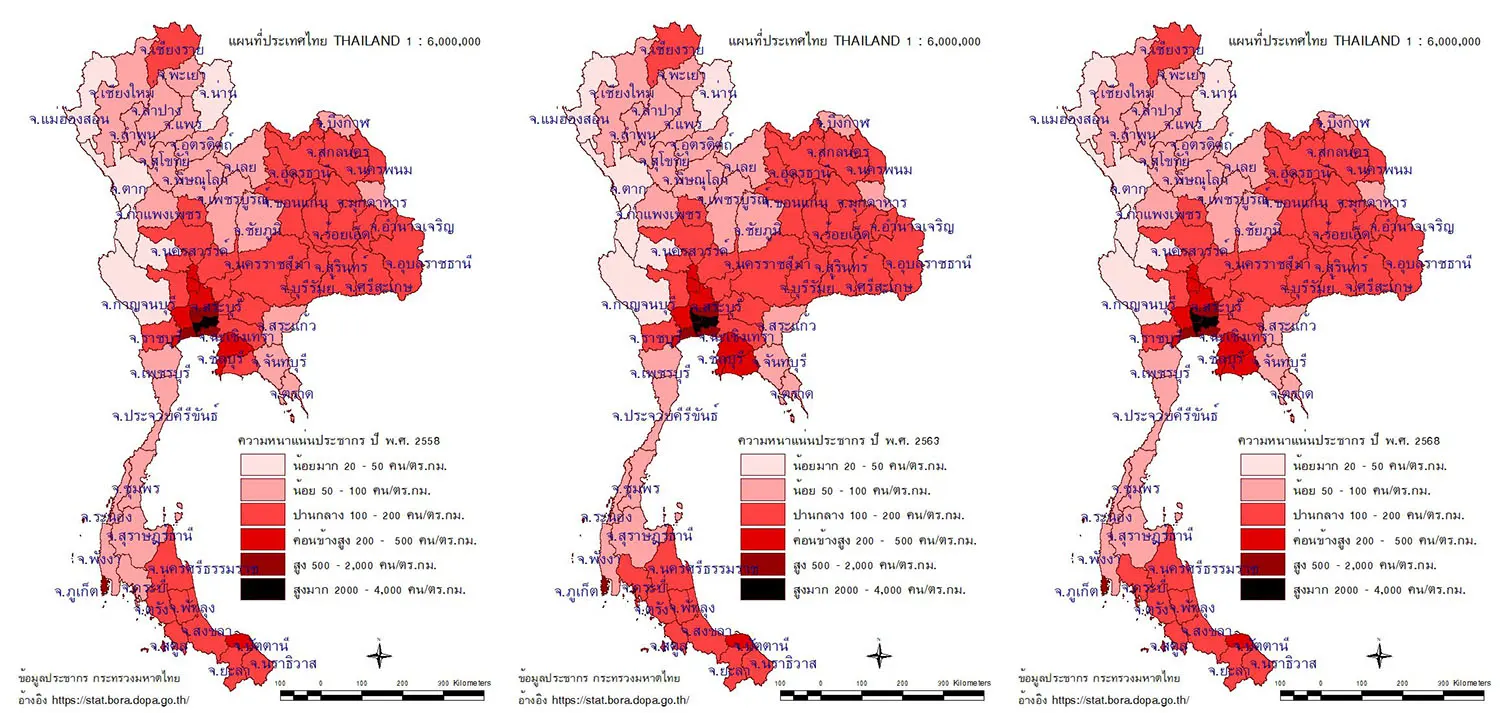
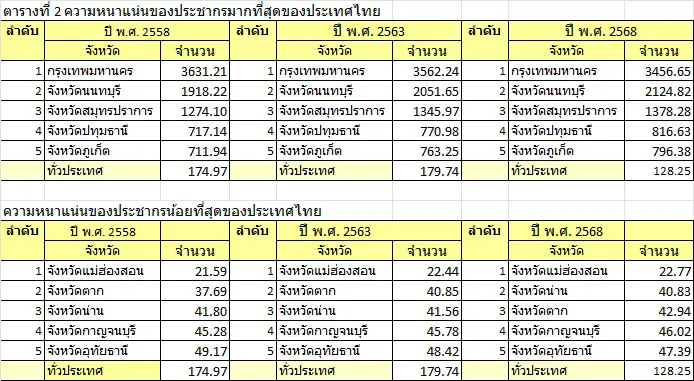
ในปี พ.ศ. 2568 กลุ่มจังหวัดที่มีประชากรหนาแน่นสูงมากจะอยู่บริเวณภาคกลาง โดยจังหวัดที่มีประชากรหนาแน่นมากที่สุด 5 อันดับแรก (ตารางที่ 2) คือ กรุงเทพมหานคร นนทบุรี สมุทรปราการ ปทุมธานี และภูเก็ต ตามลำดับ ส่วนจังหวัดที่ประชากรหนาแน่นน้อยที่สุด 5 อันดับ คือ แม่ฮ่องสอน น่าน ตาก กาญจนบุรี และอุทัยธานี และเมื่อพิจารณาย้อนหลังไป 5 ปี (ปี พ.ศ. 2563) และ 10 ปี (พ.ศ. 2558) จังหวัดที่มีประชากรหนาแน่นมากที่สุด และจังหวัดที่มีประชากรหนาแน่นน้อยที่สุด 5 อันดับก็ยังเป็นกลุ่มจังหวัดเดิม
In 2025 (B.E. 2568), provinces with very high population density were concentrated in the Central Region. The five provinces with the highest population density (Table 2) were Bangkok, Nonthaburi, Samut Prakan, Pathum Thani, and Phuket, respectively, while the five with the lowest were Mae Hong Son, Nan, Tak, Kanchanaburi, and Uthai Thani. These rankings remained largely unchanged compared with 2020 (B.E. 2563) and 2015 (B.E. 2558).
เมื่อพิจารณาการกระจายตัวของกลุ่มจังหวัดตามความหนาแน่นของประชากร (รูปที่ 2) พบว่า ในปี พ.ศ. 2568 กลุ่มจังหวัดตามความหนาแน่นของประชากรมากเด่นชัดบริเวณกลุ่มจังหวัดภาคกลางต่อเนื่องไปถึงภาคตะวันออกเฉียงเหนือ และภาคใต้ตอนล่าง โดยจังหวัดที่มีประชากรหนาแน่นสูงมากจะอยู่บริเวณกรุงเทพมหานครและจังหวัดโดยรอบ เมื่อนำข้อมูลย้อนหลังไป 5 ปี (ปี พ.ศ. 2563) และ 10 ปี (พ.ศ. 2558) กลุ่มจังหวัดที่มีความหนาแน่นของประชากรมากก็ยังปรากฏเด่นชัดบริเวณกลุ่มจังหวัดภาคกลางต่อเนื่องไปถึงภาคตะวันออกเฉียงเหนือ และภาคใต้ตอนล่างเช่นกัน
The spatial distribution of population density (Figure 2) likewise showed a consistent pattern across the three periods. In 2025, areas of relatively high population density extended from the Central Region toward the Northeastern Region and the lower Southern Region, with very high density concentrated in Bangkok and the surrounding provinces. This overall geographic pattern was also evident in 2020 and 2015.
การกระจายตัวของครัวเรือนจากจำนวนครัวเรือนแต่ละจังหวัด
Household Distribution by Number of Households in Each Province
รูปที่ 3 กระจายตัวของครัวเรือนในปี พ.ศ. 2558 2563 2568
Figure 3. Distribution of Households in 2015, 2020, and 2025
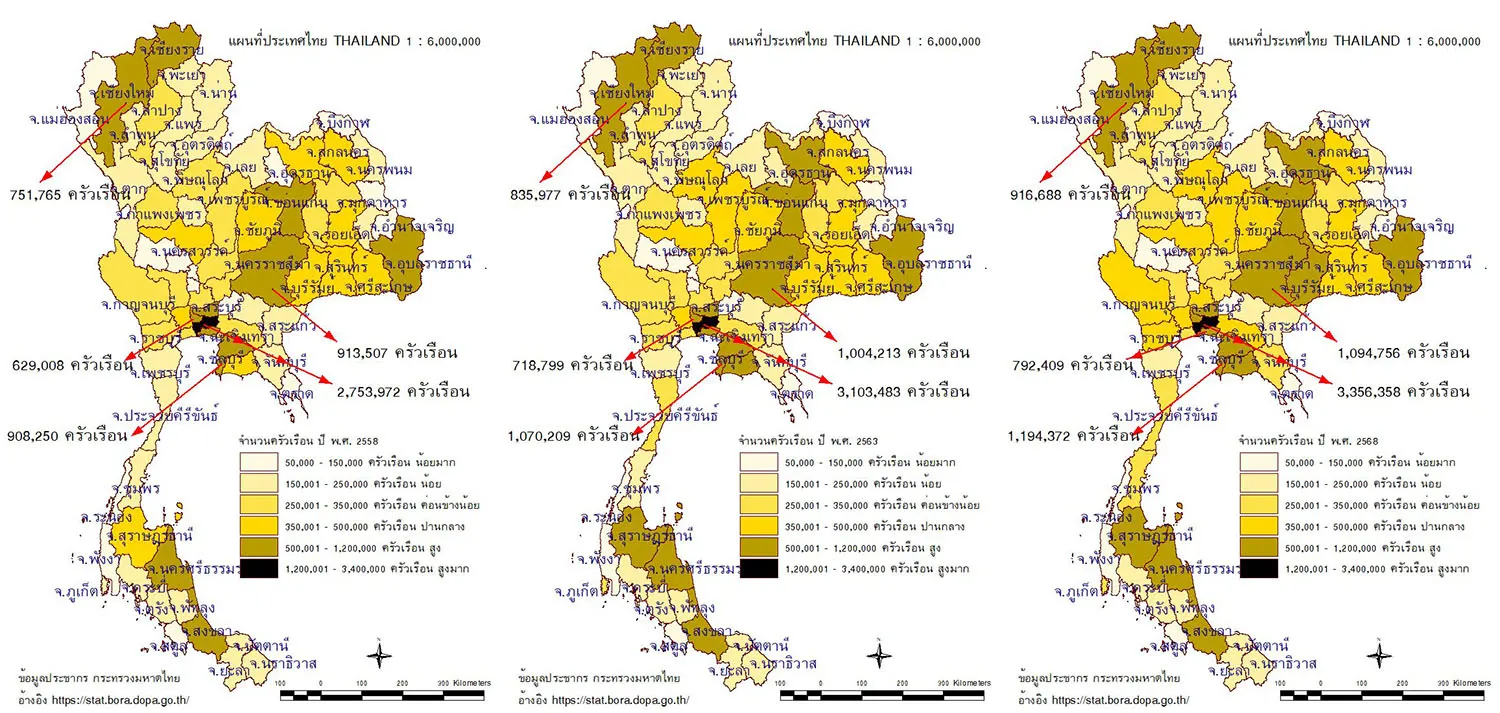
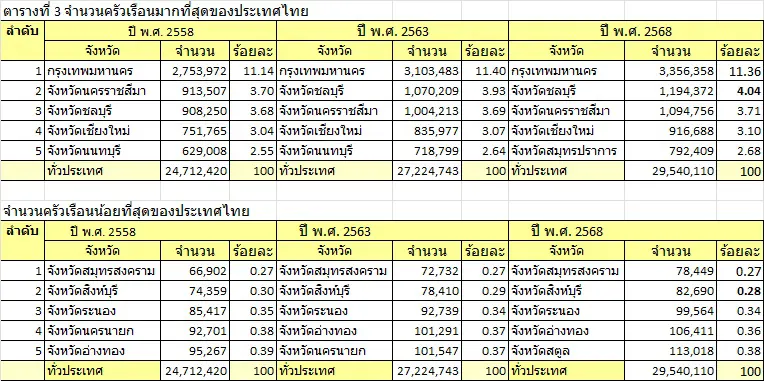
จากข้อมูลจำนวนครัวเรือนสิ้นปี 2568 พบว่าจังหวัดที่มีครัวเรือนจำนวนมากที่สุด 5 อันดับ (ตารางที่ 3) คือ กรุงเทพมหานคร ชลบุรี นครราชสีมา เชียงใหม่ และสมุทรปราการ ตามลำดับ จังหวัดที่มีประชากรจำนวนน้อยที่สุด 5 อันดับ คือ สมุทรสาคร สิงห์บุรี ระนอง อ่างทอง และสตูล ตามลำดับ และเมื่อพิจารณาย้อนหลังไป 5 ปี (ปี พ.ศ. 2563) และ 10 ปี (พ.ศ. 2558) จังหวัดที่มีประชากรจำนวนมากที่สุด อันดับ 5 จากเดิมคือ นนทบุรี เปลี่ยนเป็น สมุทรปราการ ในปี 2568 ส่วนจังหวัดที่มีประชากรจำนวนน้อยที่สุด 5 อันดับ ในปี พ.ศ. 2558 และ พ.ศ. 2563 จังหวัดนครนายก จะอยู่ใน 5 อันดับ แต่ในปี พ.ศ. 2568 เปลี่ยนเป็นจังหวัดสตูล
Based on the number of households at the end of 2025 (B.E. 2568), the five provinces with the largest numbers of households (Table 3) were Bangkok, Chon Buri, Nakhon Ratchasima, Chiang Mai, and Samut Prakan, respectively. The five provinces with the smallest numbers of households were Samut Sakhon, Sing Buri, Ranong, Ang Thong, and Satun, respectively. Looking back five years to 2020 (B.E. 2563) and ten years to 2015 (B.E. 2558), the province ranked fifth among those with the largest number of households changed from Nonthaburi to Samut Prakan in 2025. Among the five provinces with the smallest numbers of households, Nakhon Nayok was included in the bottom five in both 2015 and 2020, but was replaced by Satun in 2025.
อย่างไรก็ตาม เมื่อพิจารณานำข้อมูลจำนวนครัวเรือนแต่ละจังหวัดมาแสดงเป็นแผนที่ (รูปที่ 3) พบว่า ในปี พ.ศ. 2568 กลุ่มจังหวัดที่มีจำนวนครัวเรือนมากในแต่ละภาคจะกระจายออกไป ไม่เกาะกลุ่มอย่างเด่นชัด เมื่อพิจารณาย้อนหลังไป 5 ปี (ปี พ.ศ. 2563) และ 10 ปี (พ.ศ. 2558) ก็จะมีลักษณะเดียวกัน
However, when the number of households in each province is presented spatially on a map (Figure 3), the provinces with large numbers of households in 2025 are distributed across the different regions rather than forming clearly defined clusters. A similar spatial pattern can also be observed when looking back five years to 2020 (B.E. 2563) and ten years to 2015 (B.E. 2558).
เมื่อนำข้อมูลสัดส่วนของจำนวนครัวเรือนกับขนาดพื้นที่แต่ละจังหวัด (ความหนาแน่นของครัวเรือน) มาประมวลผล พบลักษณะการกระจายตัวของข้อมูล ดังนี้
When the number of households is related to the area of each province to calculate household density, the resulting spatial distribution can be described as follows:
รูปที่ 4 ความหนาแน่นครัวเรือนในปี พ.ศ. 2558 2563 2568
Figure 4. Household Density in 2015, 2020, and 2025
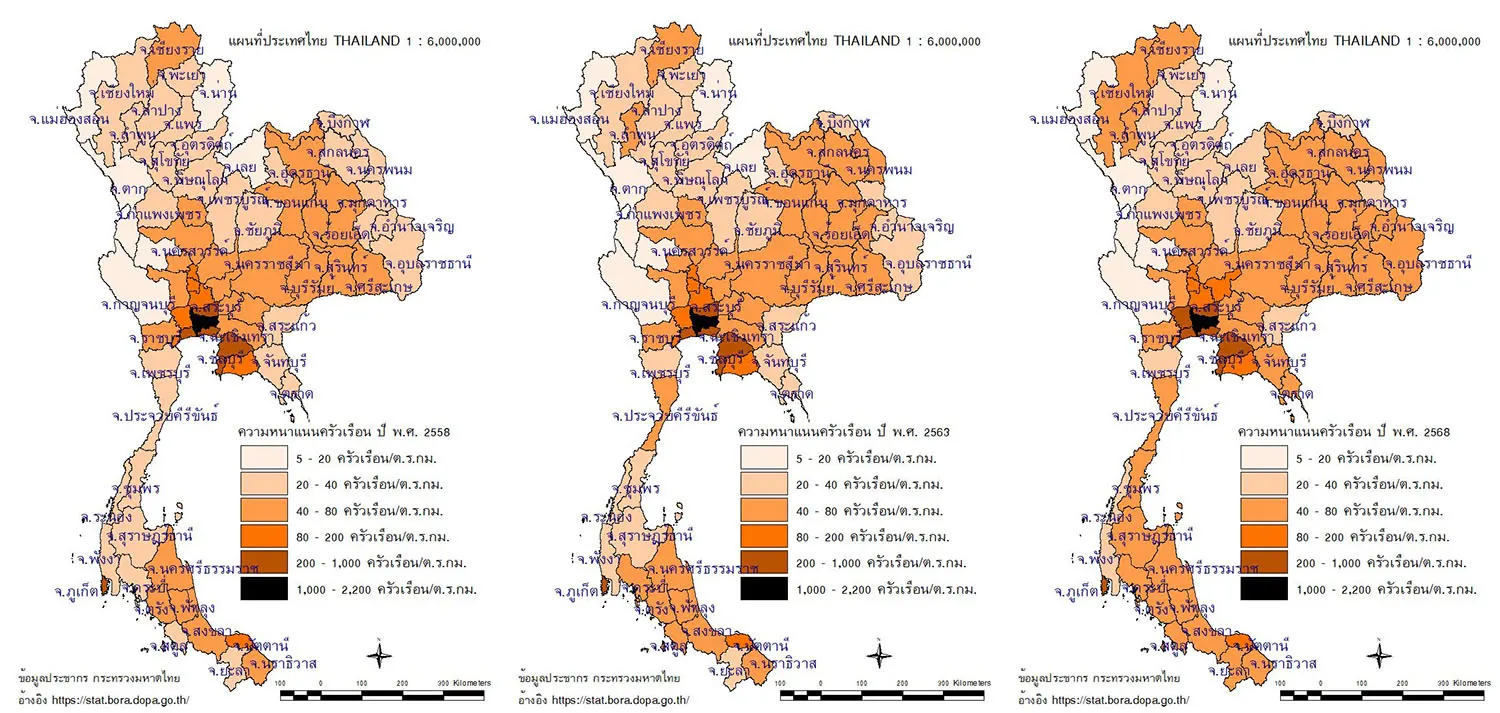
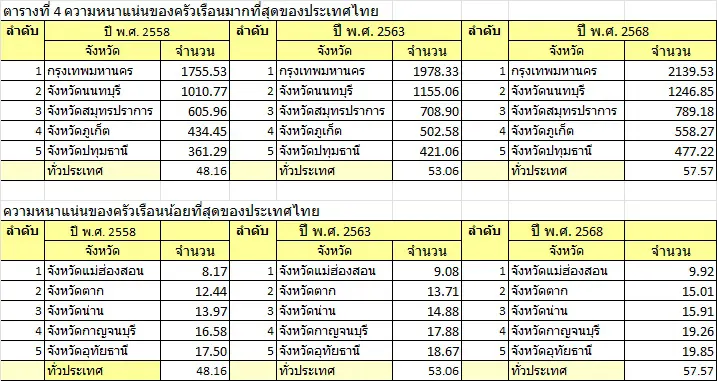
ในปี พ.ศ. 2568 กลุ่มจังหวัดที่มีครัวเรือนหนาแน่นสูงมากที่สุด 5 อันดับแรก (ตารางที่ 4) คือ กรุงเทพมหานคร นนทบุรี สมุทรปราการ ภูเก็ต และปทุมธานีตามลำดับ ส่วนจังหวัดที่ครัวเรือนหนาแน่นน้อยที่สุด 5 อันดับ คือ แม่ฮ่องสอน ตาก น่าน กาญจนบุรี และอุทัยธานี และเมื่อพิจารณาย้อนหลังไป 5 ปี (ปี พ.ศ. 2563) และ 10 ปี (พ.ศ. 2558) จังหวัดที่มีครัวเรือนหนาแน่นมากที่สุด และจังหวัดที่มีประชากรหนาแน่นน้อยที่สุด 5 อันดับก็ยังเป็นกลุ่มจังหวัดเดิม
In 2025, the five provinces with the highest household density (Table 4) were Bangkok, Nonthaburi, Samut Prakan, Phuket, and Pathum Thani, respectively. The five with the lowest were Mae Hong Son, Tak, Nan, Kanchanaburi, and Uthai Thani. Looking back five years to 2020 and ten years to 2015, the provinces at the highest and lowest ends remained largely unchanged.
เมื่อพิจารณาการกระจายตัวของกลุ่มจังหวัดตามความหนาแน่นของครัวเรือน (รูปที่ 4) พบว่า ในปี พ.ศ. 2568 กลุ่มจังหวัดตามความหนาแน่นของครัวเรือนมากเด่นชัดจะเป็นกลุ่มจังหวัดในภาคกลาง โดยมีกรุงเทพมหานครเป็นเหมือนแกนกลางต่อเนื่องไปทางภาคตะวันออกและตะวันออกเฉียงเหนือ สำหรับภาคเหนือมีเพียงจังหวัดเชียงราย เชียงใหม่และลำพูนเท่านั้นที่มีความหนาแน่นของครัวเรือนมากเด่นชัด ส่วนภาคใต้เกือบทั้งภาค ถือได้ว่ามีความหนาแน่นของครัวเรือนในระดับปานกลางเมื่อเทียบกับทั้งประเทศ โดยมีจังหวัดภูเก็ตเพียงจังหวัดเดียวที่มีความหนาแน่นของครัวเรือนมากอย่างเด่นชัด
The spatial distribution of provinces by household density (Figure 4) shows that, in 2025, high-density provinces were concentrated in the Central Region, with Bangkok as the core and the pattern extending eastward and northeastward. In the North, Chiang Rai, Chiang Mai, and Lamphun stood out, while most southern provinces were at moderate levels relative to the national average. Phuket was the only southern province with notably high household density.
เมื่อนำข้อมูลการกระจายตัวของกลุ่มจังหวัดตามความหนาแน่นของครัวเรือนย้อนหลังไป 5 ปี (ปี พ.ศ. 2563) และ 10 ปี (พ.ศ. 2558) กลุ่มจังหวัดที่มีความหนาแน่นของประชากรมากก็ยังปรากฏเด่นชัดบริเวณกลุ่มจังหวัดภาคกลางต่อเนื่องไปถึงภาคตะวันออกและภาคตะวันออกเฉียงเหนือเช่นเดิม สำหรับภาคเหนือ ปี พ.ศ. 2558 มีเพียงจังหวัดเชียงรายที่มีความหนาแน่นของครัวเรือนมากเด่นชัด ส่วนภาคใต้มีเพียงจังหวัดทางตอนล่างที่มีความหนาแน่นของครัวเรือนในระดับปานกลางเมื่อเทียบกับทั้งประเทศ โดยจังหวัดภูเก็ตเพียงจังหวัดเดียวที่มีความหนาแน่นของครัวเรือนมากอย่างเด่นชัด
Over the previous five and ten years, this overall pattern remained consistent, with the Central Region forming the main concentration and extending into the Eastern and Northeastern regions. In 2015, Chiang Rai was the only northern province that stood out, while in the South, moderate levels were concentrated mainly in the lower part of the region, with Phuket again being the sole province with notably high household density.
เปรียบเทียบการกระจายตัวของประชากรและครัวเรือนแต่ละจังหวัดในปี พ.ศ. 2568
Comparing the Distribution of Population and Households across Provinces in 2025
รูปที่ 5 เปรียบเทียบการกระจายตัวของประชากรแต่ละจังหวัดในปี พ.ศ. 2568
Figure 5. Comparison of Population Distribution across Provinces in 2025
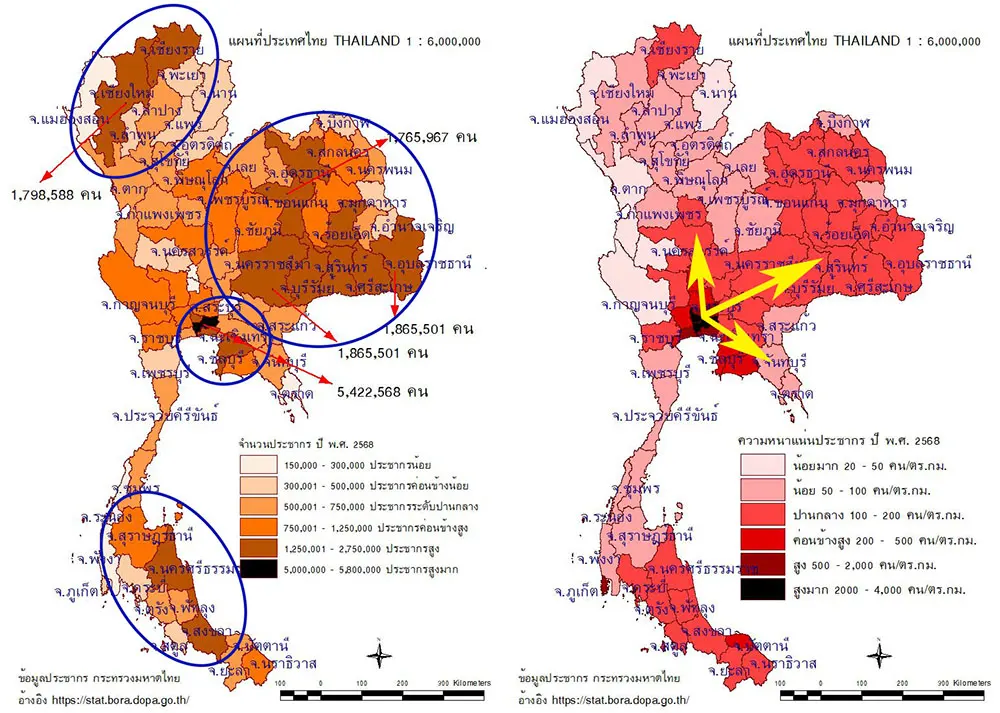
หากพิจารณาการกระจายตัวของประชากรจากข้อมูลจำนวนประชากรและความหนาแน่นของประชากรในปี พ.ศ. 2568 (รูปที่ 5) พบว่ามีความแตกต่างกันอย่างเด่นชัด โดยเฉพาะจากข้อมูลความหนาแน่นของประชากรพบว่ากลุ่มประชากรส่วนใหญ่เกาะกลุ่มอยู่บริเวณกรุงเทพมหานครและจังหวัดโดยรอบและกระจายต่อเนื่องไปทางเหนือ ตะวันออกและตะวันออกเฉียงเหนือ
When considering population distribution based on population size and population density in 2025 (Figure 5), clear differences can be observed. In particular, population density indicates that the majority of the population is concentrated in Bangkok and the surrounding provinces, with this concentration extending continuously toward the north, east, and northeast.
รูปที่ 6 เปรียบเทียบการกระจายตัวของครัวเรือนแต่ละจังหวัด ในปี พ.ศ. 2568
Figure 6. Comparison of Household Distribution by Province in 2025
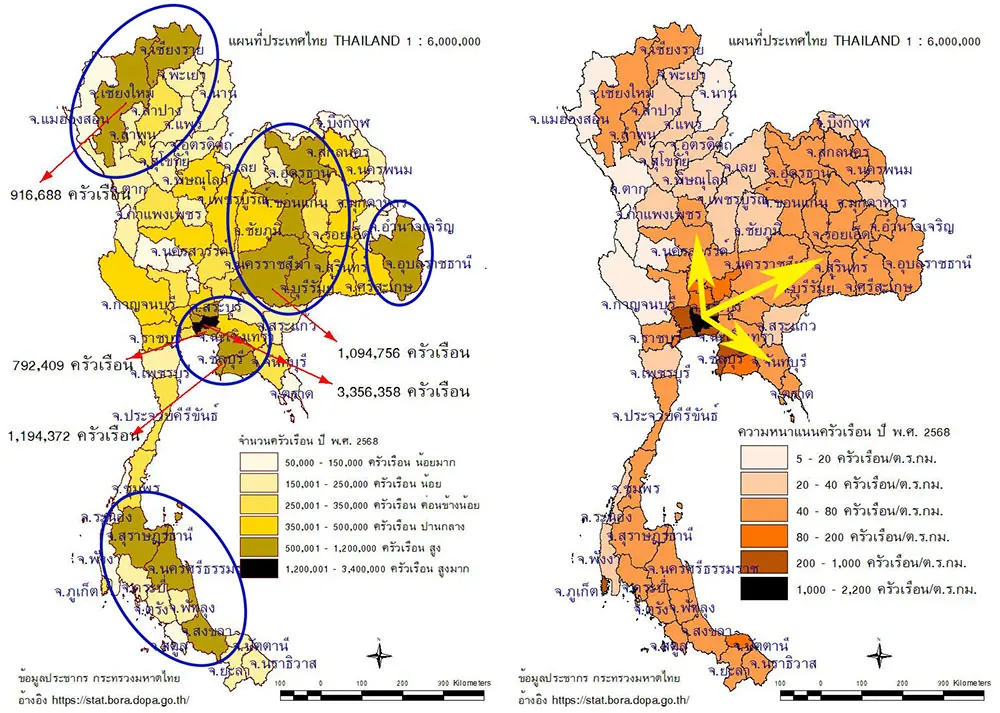
สำรับการกระจายตัวของครัวเรือนจากข้อมูลจำนวนครัวเรือนและความหนาแน่นของครัวเรือนในปี พ.ศ. 2568 (รูปที่ 6) พบว่ามีความแตกต่างกันอย่างเด่นชัด โดยข้อมูลการกระจายตัวของครัวเรือนจากความหนาแน่นของครัวเรือนจะเกาะกลุ่มอยู่บริเวณกรุงเทพมหานครและจังหวัดโดยรอบและกระจายต่อเนื่องไปทางเหนือ ตะวันออกและตะวันออกเฉียงเหนือ
The spatial distribution of households, based on the number and density of households in 2025 (Figure 6), shows clear regional differences. In particular, the distribution based on household density is concentrated in Bangkok and the surrounding provinces, with a continuous pattern extending northward, eastward, and northeastward.
เปรียบเทียบการกระจายตัวประชากรและครัวเรือนจากข้อมูลจำนวนและความหนาแน่นของประชากรและครัวเรือนแต่ละจังหวัด ในปี พ.ศ. 2568
Comparison of Population and Household Distribution Based on Population and Household Counts and Densities by Province in 2025
เมื่อนำแผนที่การกระจายตัวจากข้อมูลจำนวนประชากรและจำนวนครัวเรือนแต่ละจังหวัด ในปี พ.ศ. 2568 มาเปรียบเทียบกัน (รูปที่ 7) พบว่า มีลักษณะที่แตกต่างกันบริเวณพื้นที่ภาคตะวันออกฉียงเหนือ ในขณะที่นำแผนที่การกระจายตัวจากข้อมูลความหนาแน่นของประชากรและความหนาแน่นของครัวเรือนแต่ละจังหวัด ในปี พ.ศ. 2568 มาเปรียบเทียบกัน (รูปที่ 8) พบว่ามีลักษณะการกระจายตัวเกือบจะไม่แตกต่างกัน
When the maps showing the distribution of population and households based on the number of population and households in each province in 2025 are compared (Figure 7), distinct differences can be observed, particularly in the Northeastern region. In contrast, when the maps showing the distribution of population and household density by province in 2025 are compared (Figure 8), the overall spatial distribution patterns are found to be very similar.
รูปที่ 7 เปรียบเทียบการกระจายตัวจากข้อมูลจำนวนประชากรและจำนวนครัวเรือนแต่ละจังหวัด ในปี พ.ศ. 2568
Figure 7. Comparison of Population and Household Distribution by Province, 2025.
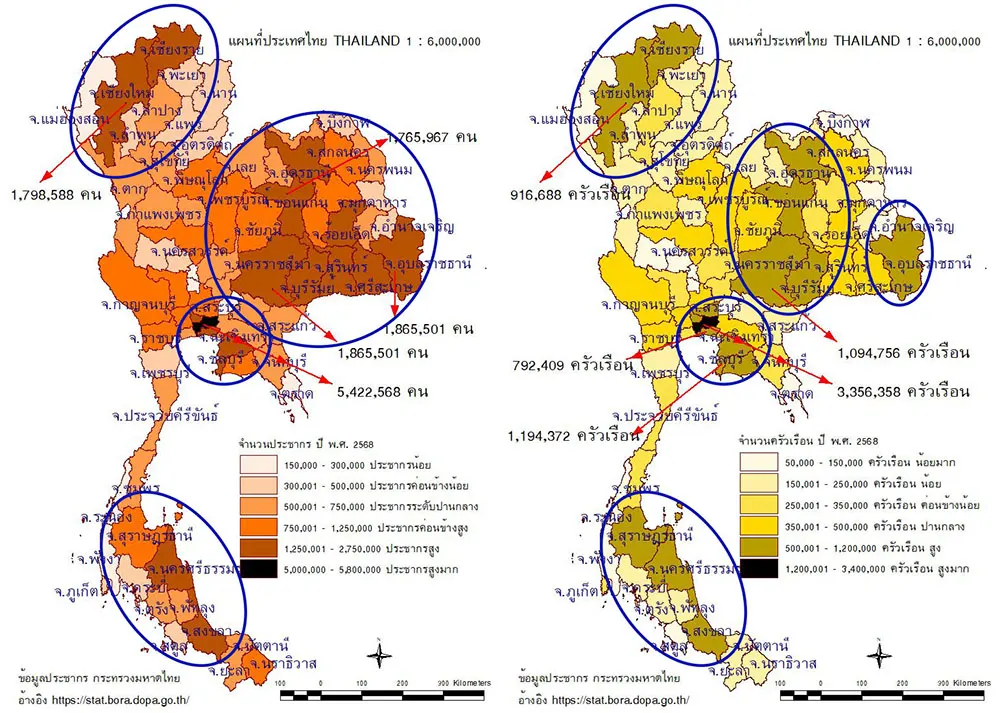
รูปที่ 8 เปรียบเทียบการกระจายตัวจากข้อมูลความหนาแน่นของประชากรและความหนาแน่นของครัวเรือนแต่ละจังหวัด ในปี พ.ศ. 2568
Figure 8. Comparison of the spatial distribution based on population density and household density across provinces in 2025.
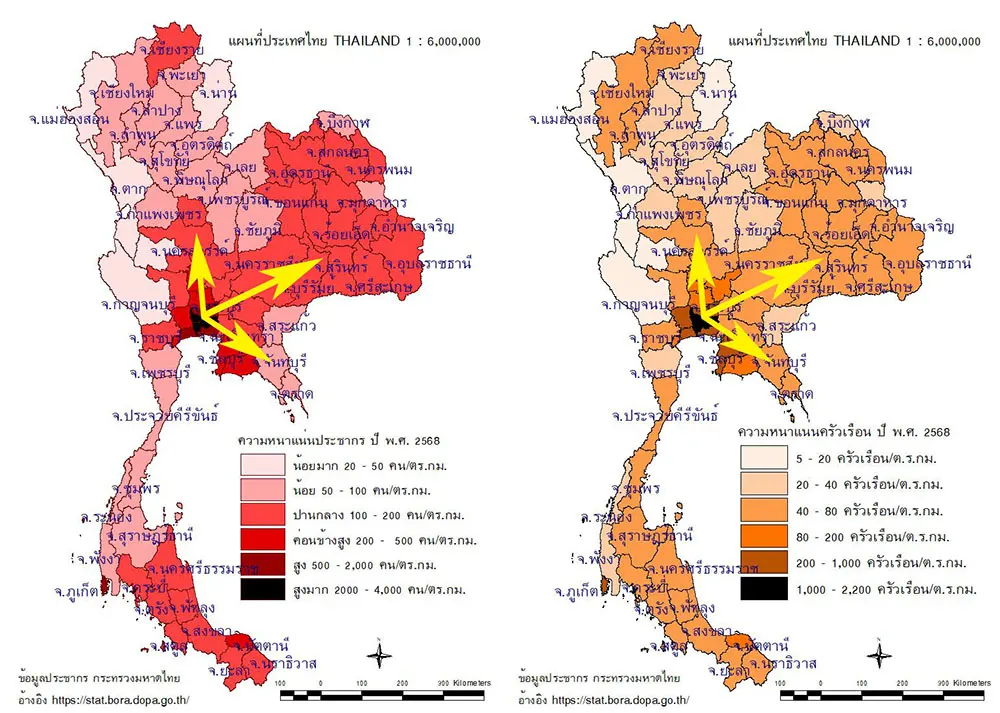
เมื่อพิจารณาการกระจายตัวจากข้อมูลความหนาแน่นของประชากรและครัวเรือนในปี พ.ศ. 2558 2563 และ 2568 (รูปที่ 2 และ รูปที่ 4) พบว่ามีลักษณะการกระจายตัวรูปแบบเดียวกัน คือ กลุ่มจังหวัดที่ความหนาแน่นมากเด่นชัดซึ่งเป็นกลุ่มจังหวัดในภาคกลาง โดยมีกรุงเทพมหานครเป็นเหมือนแกนกลางต่อเนื่องไปทางภาคเหนือ กระจายไปทางภาคตะวันออกและตะวันออกเฉียงเหนือ เป็นที่น่าสังเกตว่าในภาคใต้จังหวัดภูเก็ตเป็นจังหวัดเดียวที่ความหนาแน่นของประชากรและความหนาแน่นของครัวเรือนอยู่ในระดับสูงเด่นชัดมาตลอดทั้ง ปี 2558 2563 และ2568
When examining the spatial distribution based on population and household density in 2015, 2020, and 2025 (Figures 2 and 4), a similar distribution pattern can be observed. The high-density provinces are concentrated mainly in the Central Region, with Bangkok serving as a central axis extending northward and spreading toward the eastern and northeastern regions. Notably, in the Southern Region, Phuket is the only province where both population density and household density have remained distinctly high throughout 2015, 2020, and 2025.
หากพิจารณาในภาพรวมจะพบว่าการกระจุกและกระจายตัวของประชากรและครัวเรือนเป็นข้อมูลพื้นฐานระดับมหภาคที่ช่วยให้ทั้งภาครัฐและภาคเอกชนสามารถนำไปใช้วางแผนและจัดการระบบสาธารณูปโภค สาธารณูปการ ตลอดจนบริหารจัดการสินค้าและบริการต่าง ๆ ได้อย่างอย่างมีประสิทธิภาพ
Overall, the clustering and spatial distribution of population and households provide fundamental macro-level information that can support both the public and private sectors in planning and managing infrastructure and public utilities, as well as in the efficient provision and management of goods and services.
เมื่อพิจารณาการกระจายตัวของประชากรและครัวเรือนแล้ว ข้อมูลที่น่าสนใจอีกมุมหนึ่งคือ จำนวนประชากรต่อครัวเรือนและการเปลี่ยนแปลงประชากรและครัวเรือน ซึ่ง GEO2GIS จะได้นำเสนอข้อมูลต่อไป
When examining the distribution of population and households, another interesting perspective is the number of people per household, as well as changes in population and households. GEO2GIS will present these data in the following sections.
Anusorn Pumpuang 1/10/2026